Feeling like you're drowning in spreadsheets when trying to track teacher attendance, performance and punctuality for your language business?
Without accurate, up-to-date reports on student attendance, teacher quality, and other key metrics, it’s easy to feel unprepared and caught off guard by emerging opportunities or challenges. Many language schools and companies struggle to access the data and insights needed for informed decision-making and efficient systems. That’s why LearnCube has just introduced Insights - our ground-breaking new reporting dashboard designed to empower language leaders with:
- Gain a Comprehensive, Visual Overview of Your Language Business
- Deep Dive into Every Class to Know What Really Happens
- Access the Data and Reports You Need—Or Create Your Own
Available now in the LearnCube Online School, Insights is your is your one-stop solution to streamline operations and transform your business.
Let's explore how this unique tool can transform your school’s operations.
1. Gain a Comprehensive, Visual Overview of Your Language Business
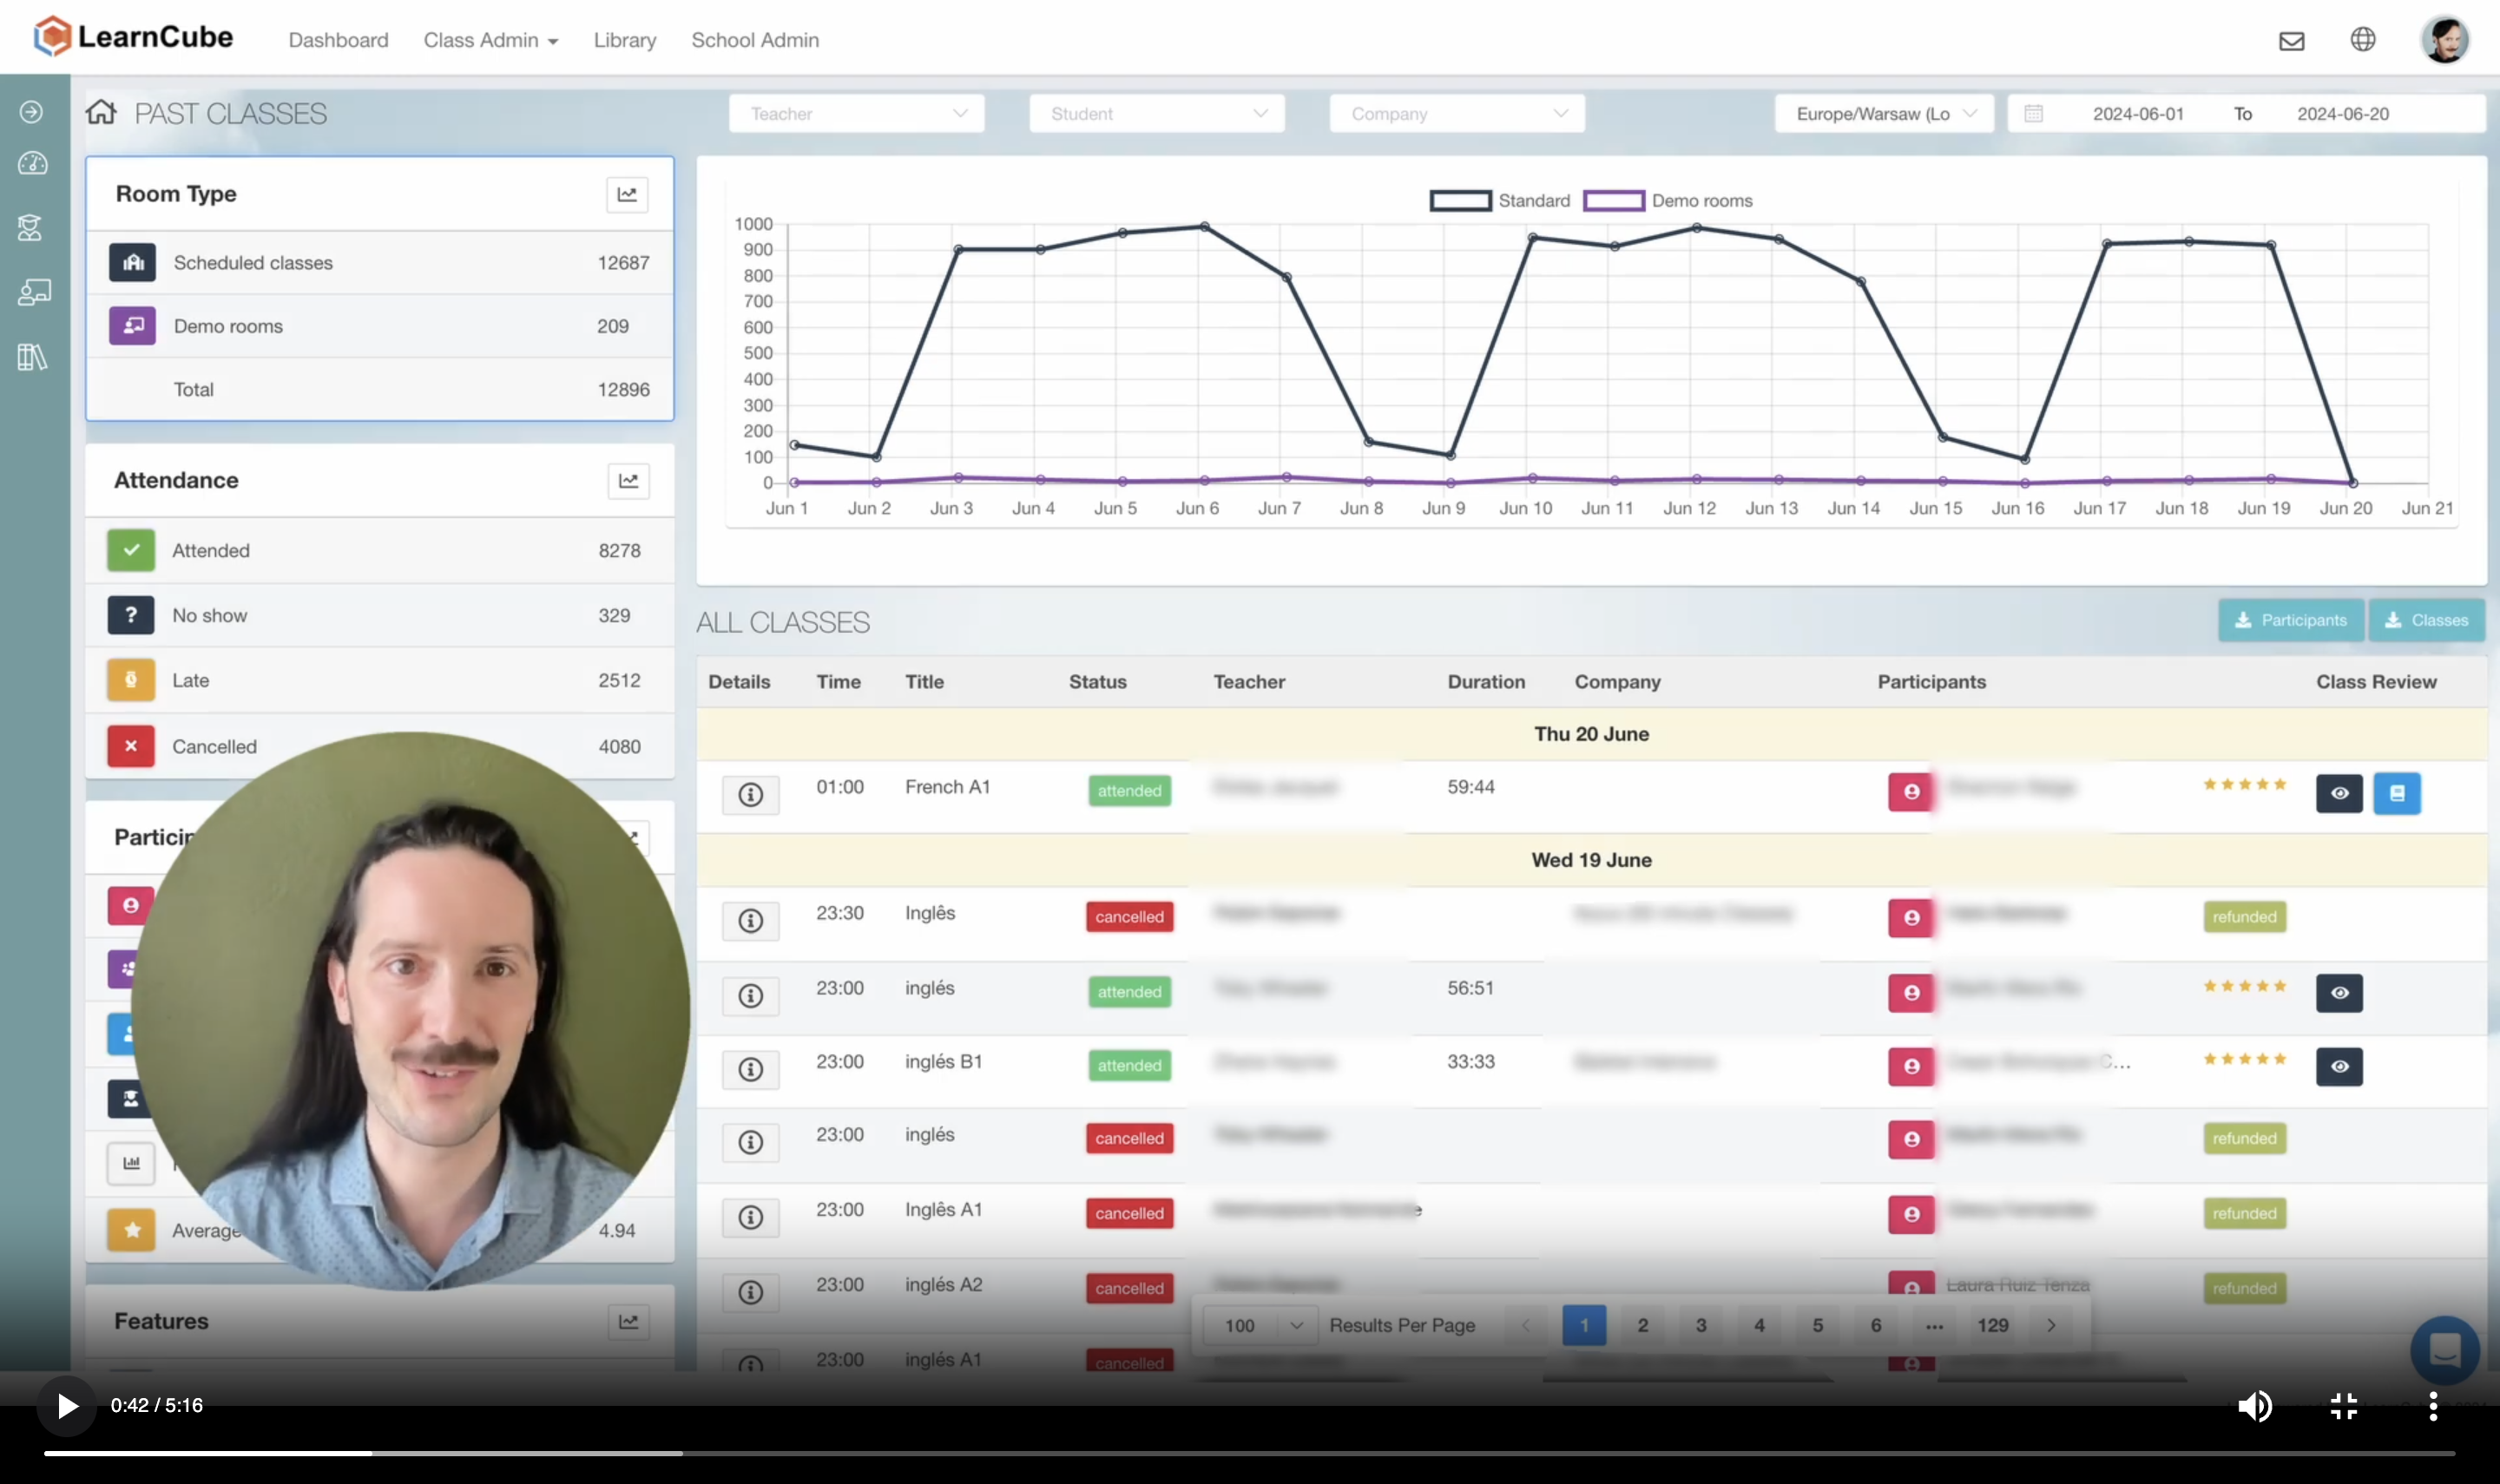
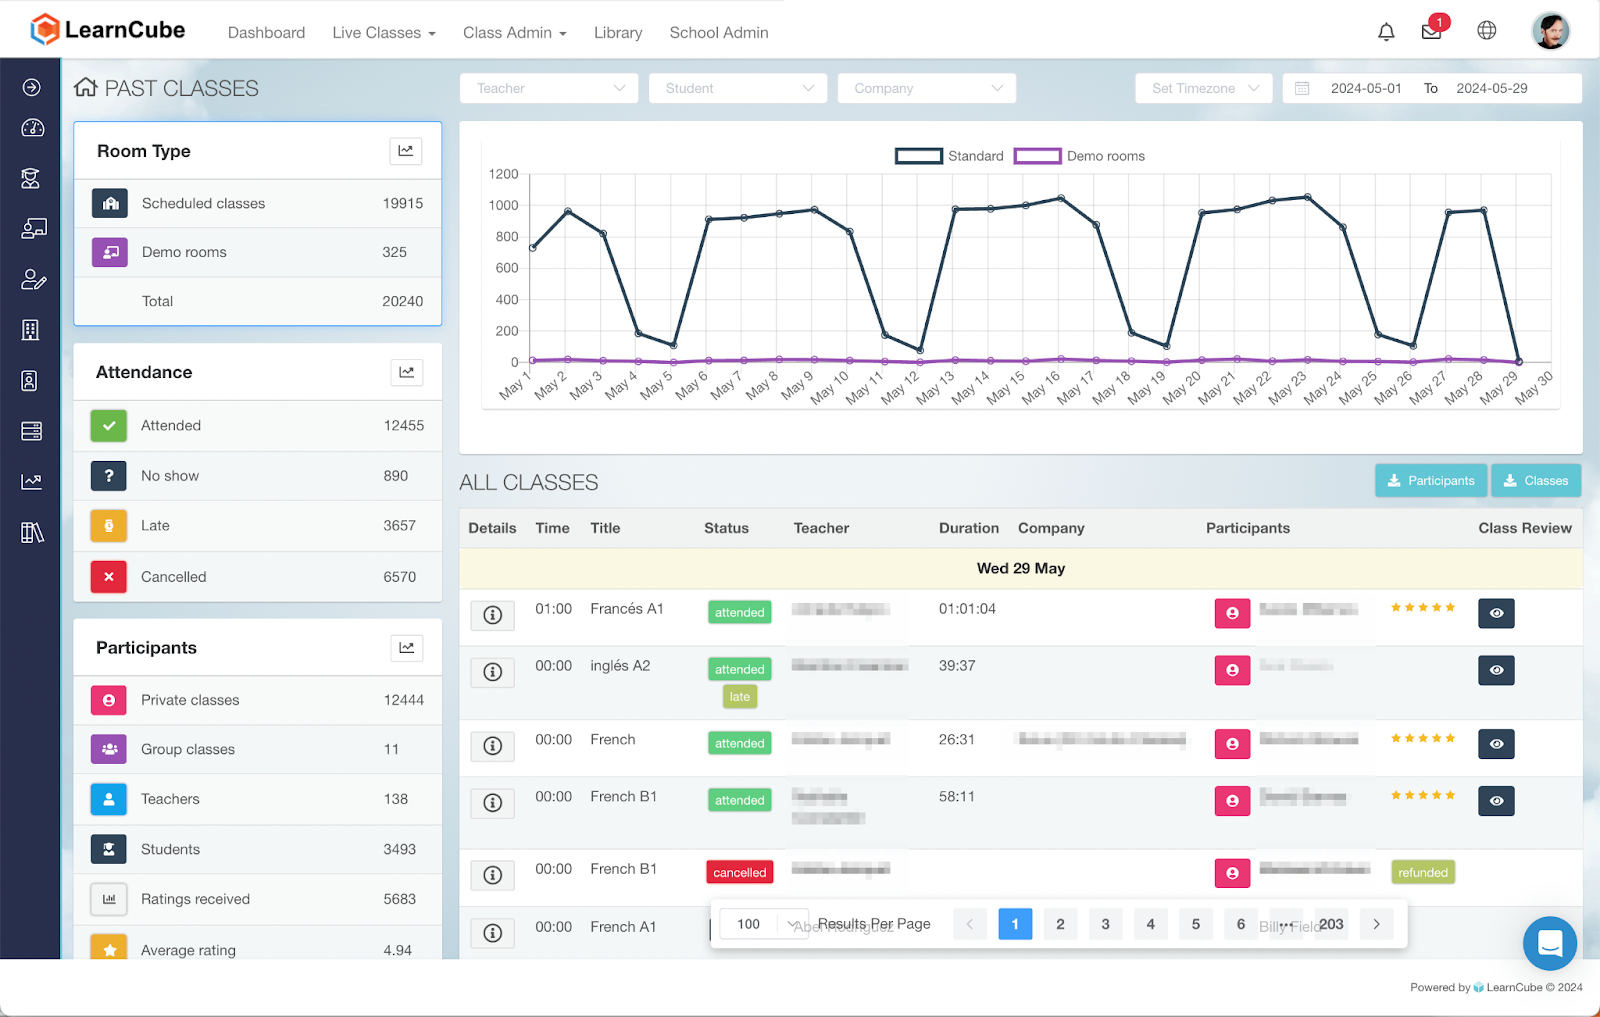
LearnCube Insights empowers school administrators and quality assurance teams with a clear, visual snapshot of your language business’s performance. The intuitive dashboard offers a bird's-eye view of key metrics such as attended, cancelled, and no-show classes, as well as class and teacher ratings.
Want to see how many classes were attended last month? Or perhaps you're curious about the no-show rate? Our colour-coded dashboard provides all the essential information at a glance. Click on any metric you're interested in to instantly update the graph.
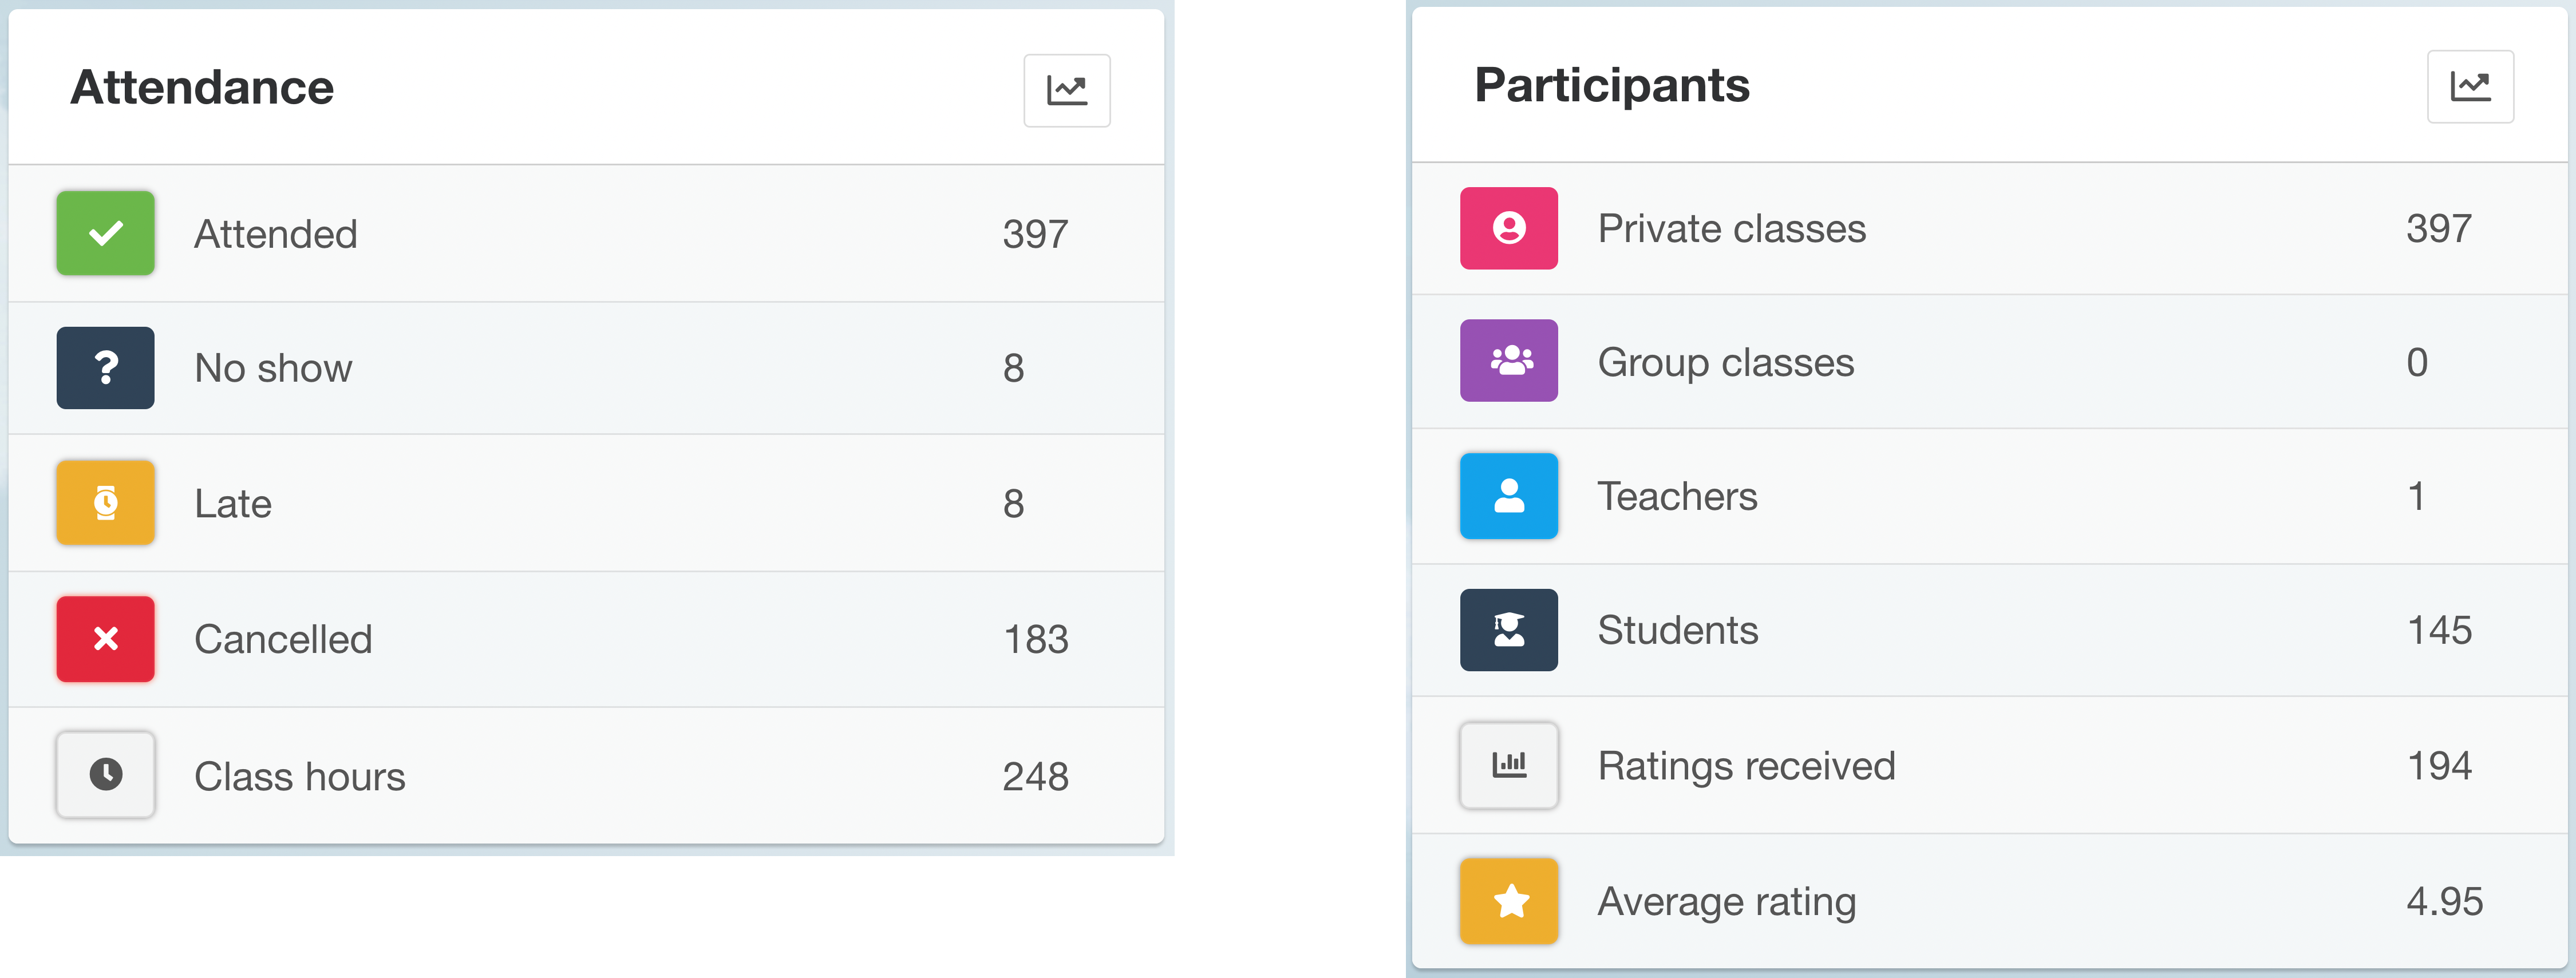
For example, if your administrators receive complaints that teachers are consistently late, they can quickly validate these concerns by clicking on the "Late" icon. This feature allows them to instantly see which classes the teacher was late for.
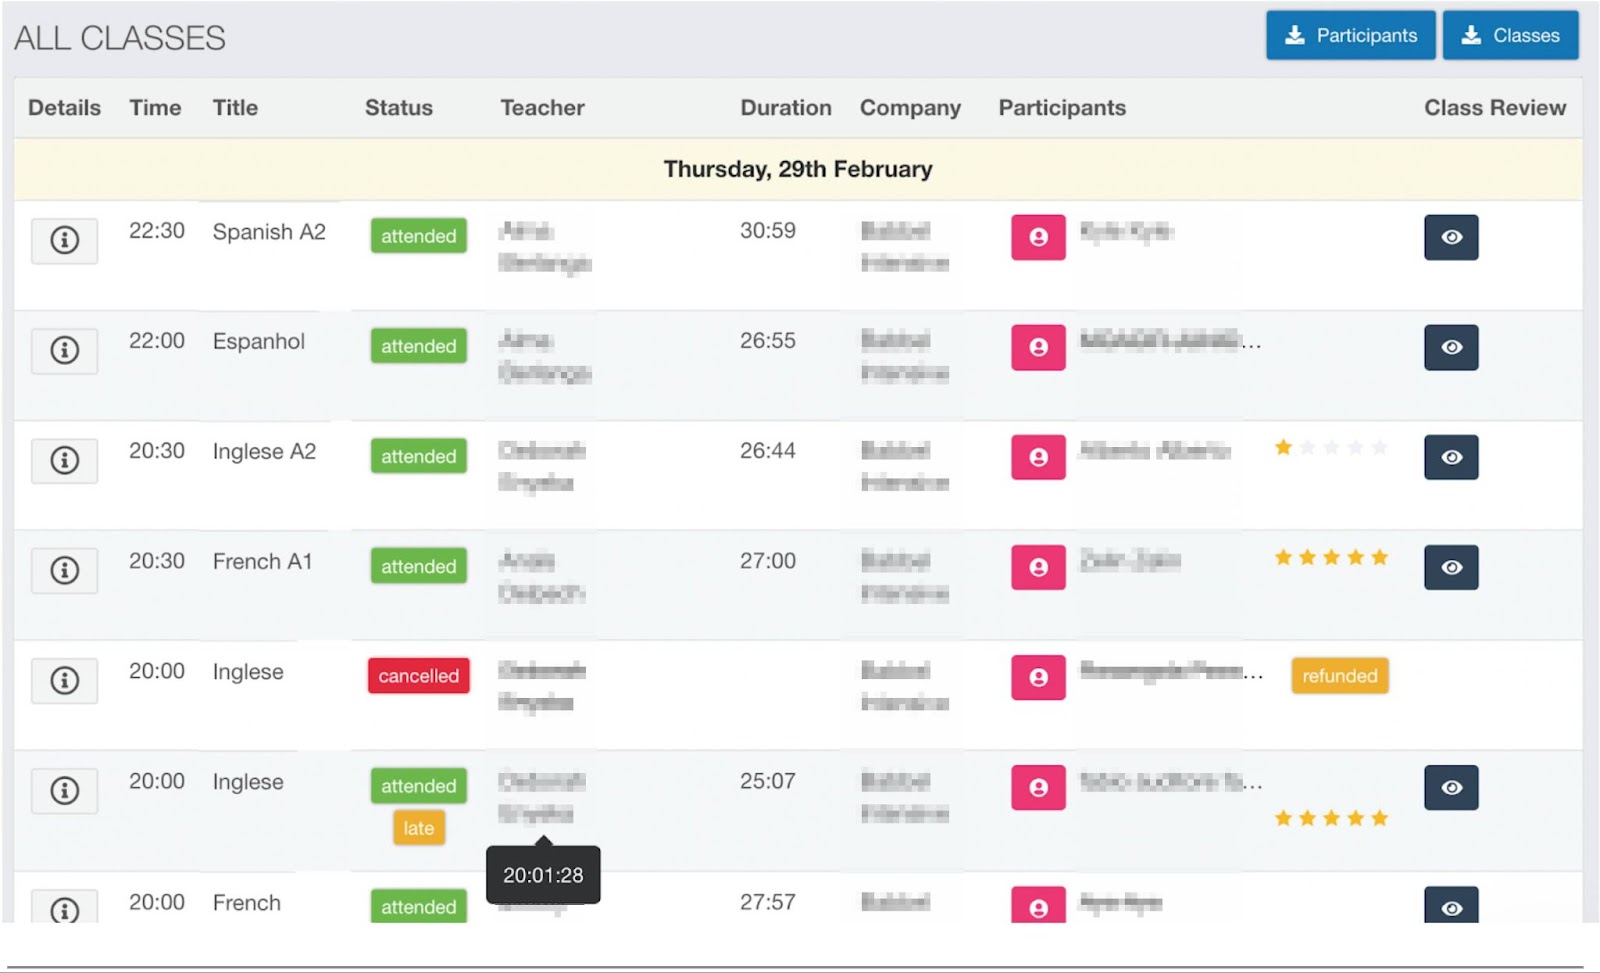
It will be clear from Insights whether there is a pattern of behaviour that requires further investigation. Administrators can even see the exact time a teacher arrives in a class by hovering over the teacher's name.
You can 
This example highlights just one of the many ways LearnCube Insights enables you to zoom in and out of the data, offering both a comprehensive overview and the tools your team can solve problems for internal and external stakeholders quickly, confidently and professionally.
2. Deep Dive into Every Class to Know What Really Happens
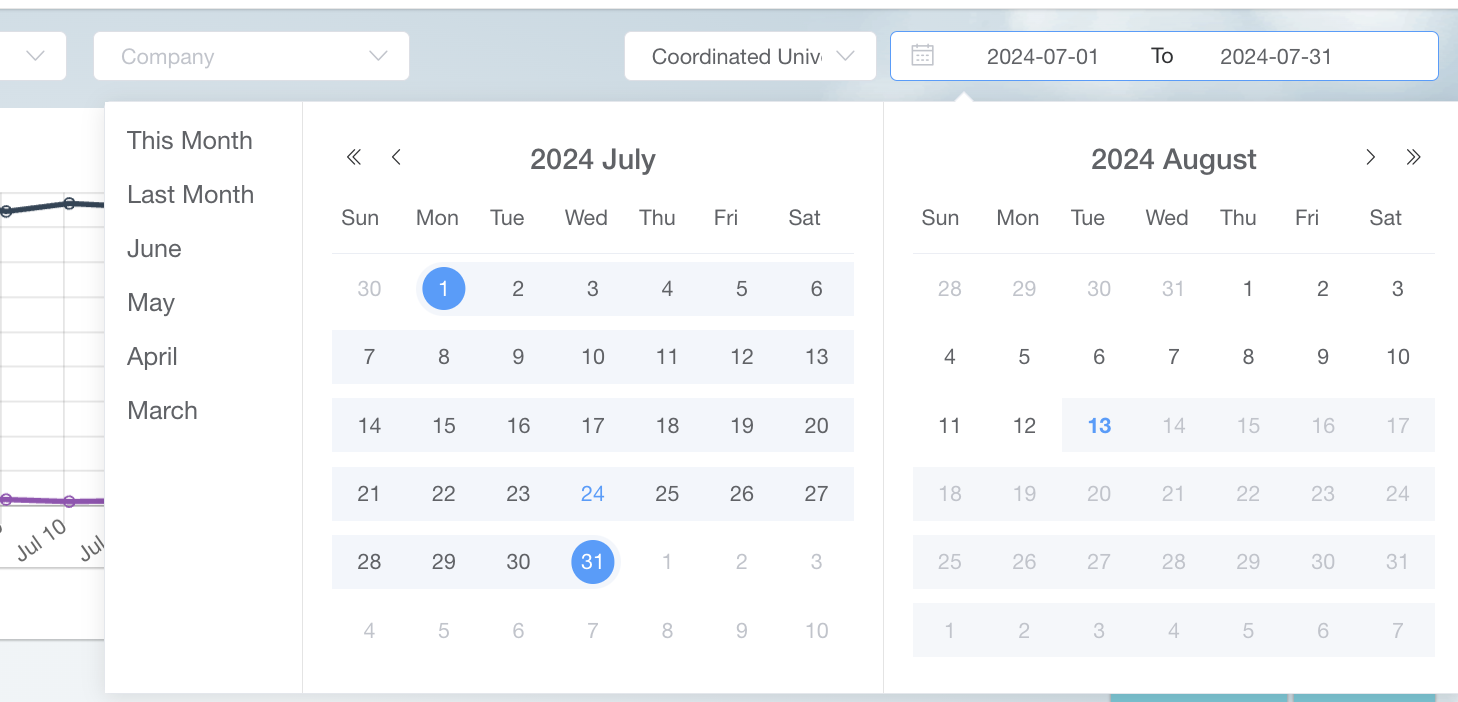
Your team can easily filter search results based on teacher, student, or company using the intuitive dropdown bars at the top of the dashboard. Simply start typing a name or username to quickly find specific users.
You can also refine your search by date range or timezone, ensuring you always have the most relevant data at your fingertips.
At the heart of the Insights dashboard is the class list. By hovering over information points, you can reveal extra details, including the Class Review, which covers everything from lesson materials used to annotations, text chat, and connection information.
Clicking on any class brings up the Class Detailed Summary, a feature that will quickly become a favourite among your teacher training and quality assurance teams. This summary provides a comprehensive view of the class, all in one place:
- When did the teacher arrive?
- What materials were used?
- What did the class "output" look like, including notes from the whiteboard?
- What was the teacher/student talk-time pattern?
- Were there any connection issues, and if so, were they fleeting or significant?
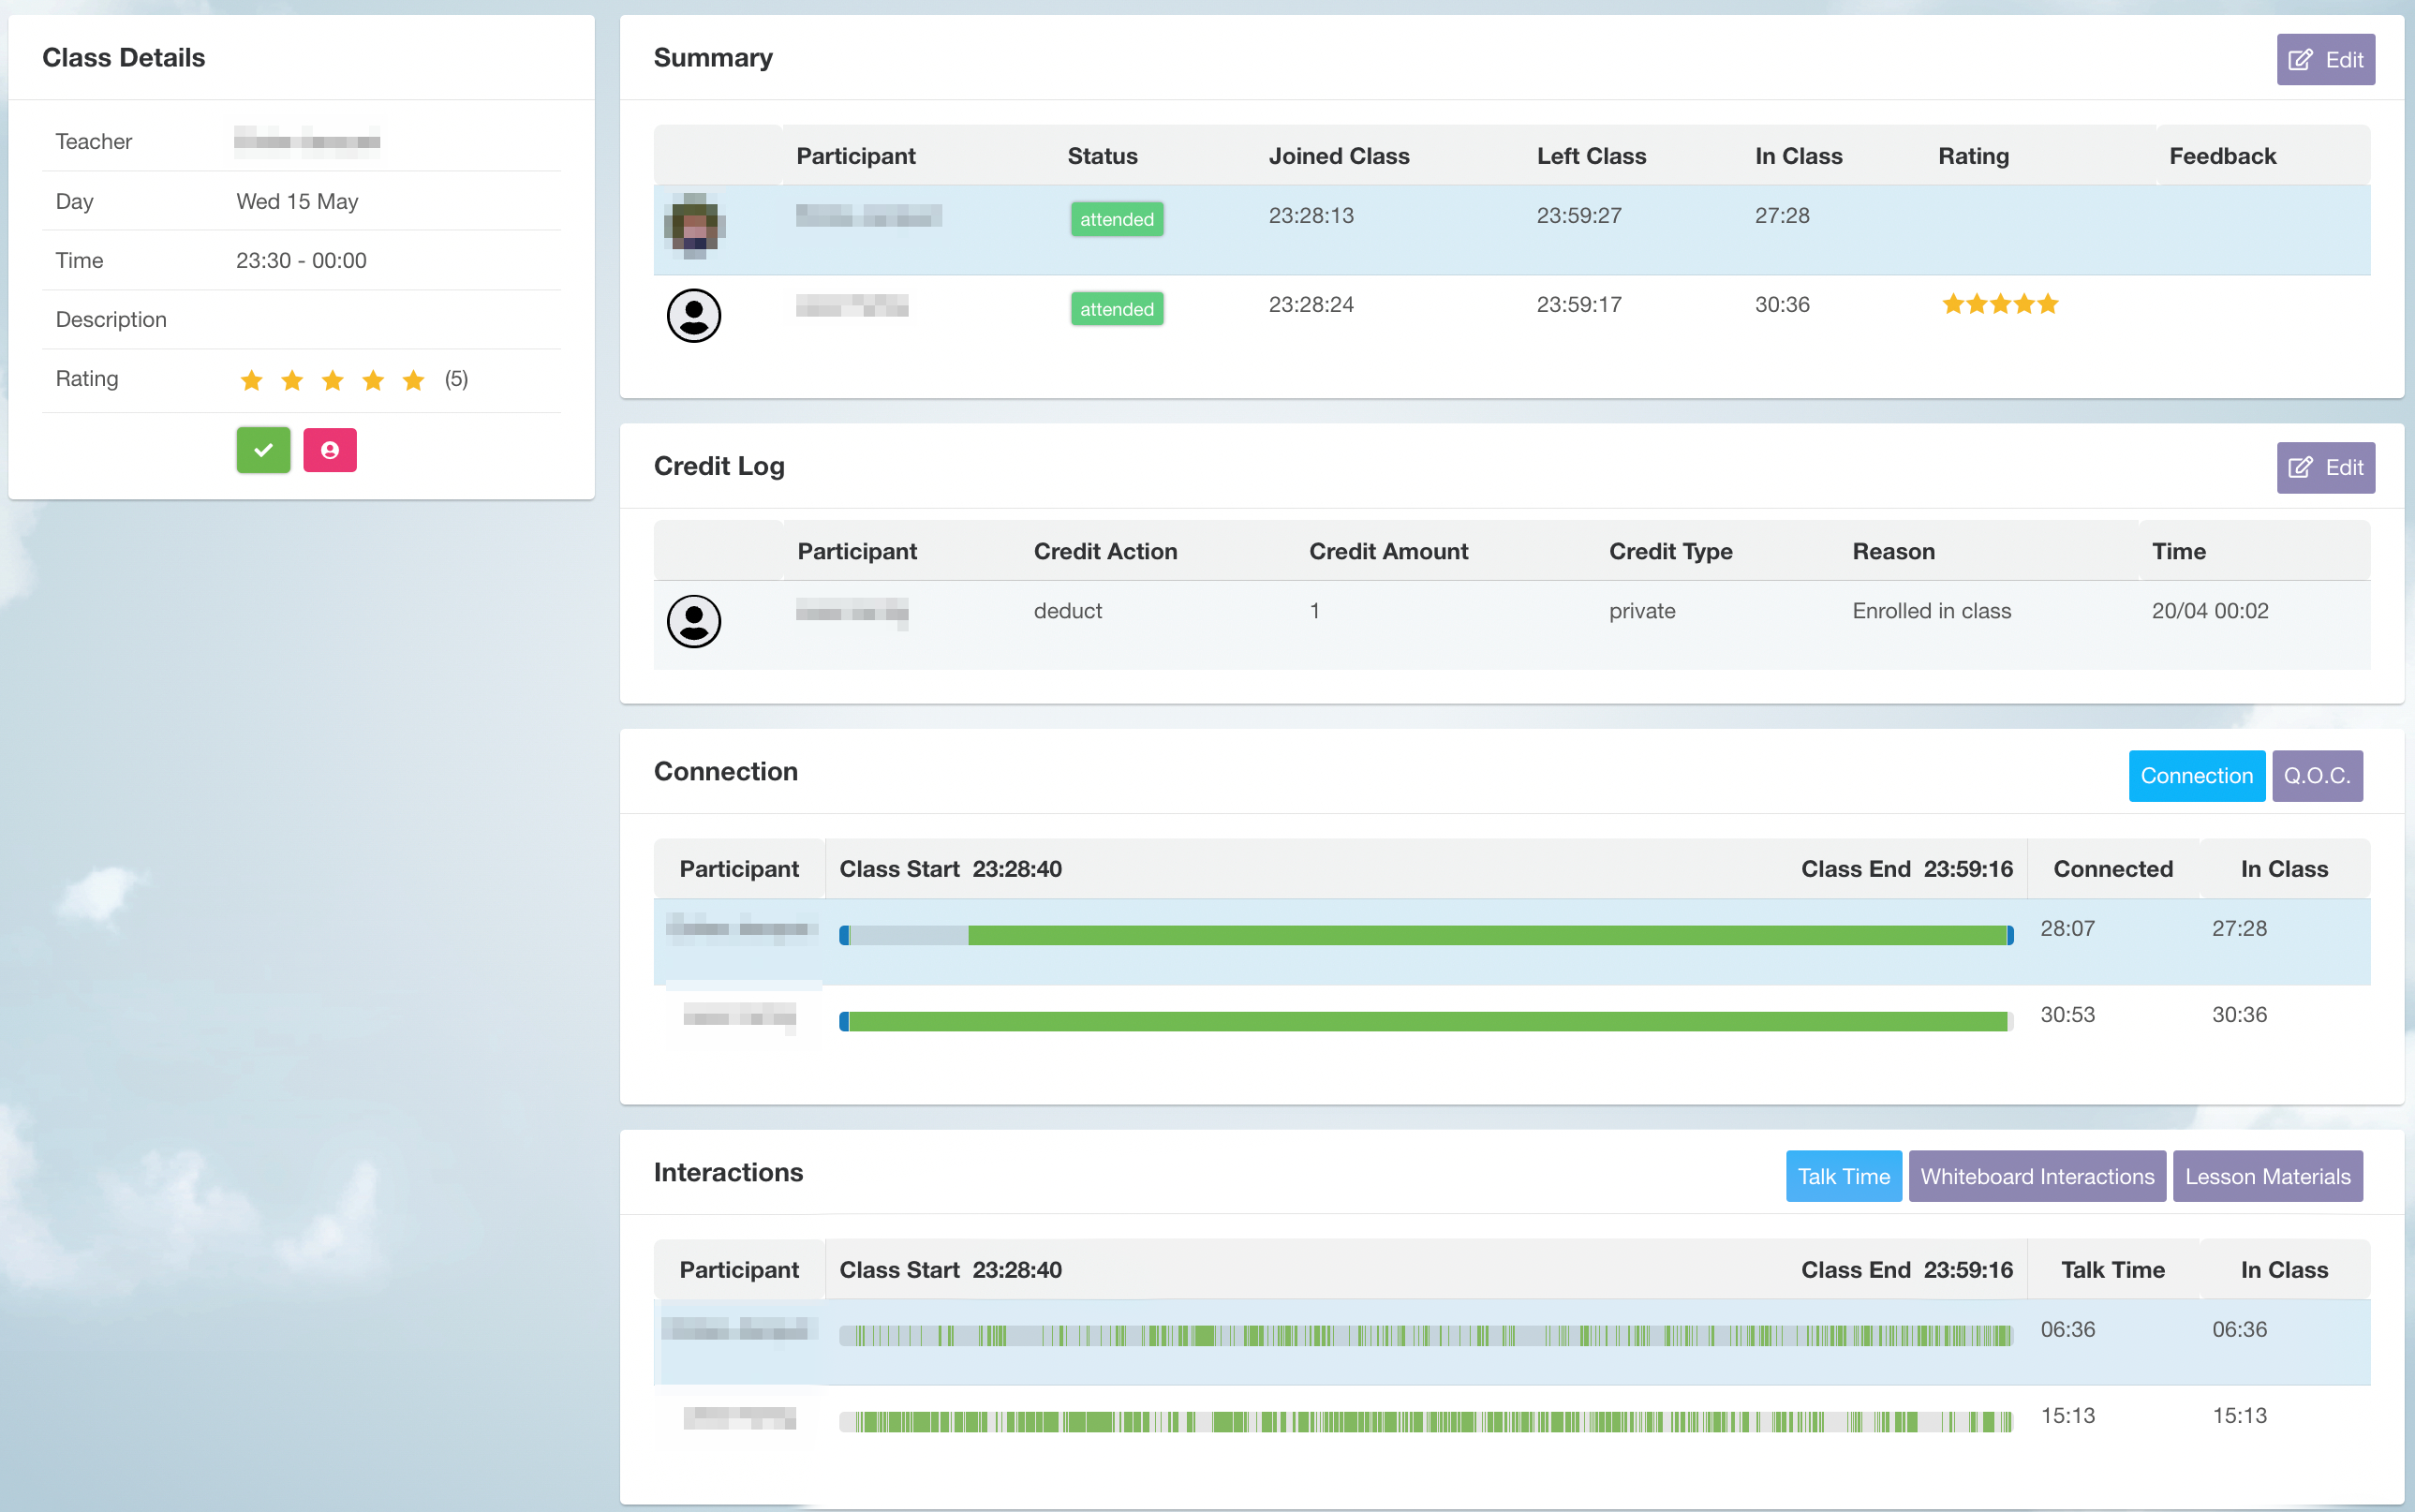
The teacher-student talk time analysis offers a fresh perspective on how classes are conducted. By examining these patterns, you can determine whether teachers are lecturing or fostering an interactive learning experience.
Quality assurance teams can now quickly identify well-taught classes with Insights without the need to sift through hours of video, making it easier to provide constructive feedback and improve both teacher and student satisfaction.
3. Access the Data and Reports You Need—Or Create Your Own
Recognising the importance of learner and customer satisfaction to the success of any language school or business, having access to precise, actionable data is essential for making informed, timely decisions.
Whether you're looking to analyze performance metrics, track attendance trends, or prepare detailed reports for your Board, LearnCube Insights offers you the flexibility and tools to get the job done.
Through the intuitive user interface of Insights, you can quickly access the data you need. The platform’s user-friendly design allows you to filter, sort, and view key metrics without needing advanced technical skills.
If you require more tailored analysis, Insights also provides the option to export data. This enables you to create custom reports in Excel, Google Sheets, or any other data processing tool you prefer, giving you the freedom to crunch numbers, identify patterns, and draw insights that are specific to your school’s needs.
Here are 6 examples of reports you can run:
- Track Teacher Performance
- Identify Unhappy Students
- Monitor Class Attendance Trends By Company (or Learner)
- Improve Class Quality
- Provide Teachers with Monthly Summary of Taught Classes
- Provide Corporate Customers with a Summary of Classes Delivered
These are just a few examples of the types of reports you can generate with LearnCube Insights.
The platform’s flexibility means that whatever your reporting needs, you have the tools at your disposal to create meaningful, data-driven insights that can drive your language school’s success.
Elevate Your Language School Today
LearnCube Insights provides the comprehensive, data-driven insights you need to streamline processes, elevate teaching quality, and boost student satisfaction. From tracking teacher performance to generating custom reports, this powerful dashboard empowers you to make informed decisions that propel your school forward. For more information on how to get the most out of LearnCube Insights, check out our detailed guide here.
Ready to take your language business to the next level?
Get in touch today for a demo of Insights at support@learncube.com.
 CEO of LearnCube


